
The Lincoln Private Market Index: Earnings Growth Drove a Q2 Rebound, While Private Markets Became More Selective
PR Newswire
CHICAGO, Aug. 13, 2026
Private company fundamentals strengthened and software performance held steady, while lender takeovers and more active secondary trading highlighted greater differentiation within otherwise stable private capital markets
CHICAGO, Aug. 13, 2026 /PRNewswire/ — Lincoln International, a global investment banking advisory firm, announced today that the Lincoln Private Market Index (LPMI), an index that tracks changes in the enterprise value of U.S. privately held companies, increased by 1.9% in Q2 2026, recovering most of its 2.2% decline in Q1. The increase was driven by EBITDA growth, which more than offset modest enterprise value multiple contraction. By comparison, S&P 500 enterprise values increased by 14.8% during the quarter, while S&P 500 enterprise values excluding the Magnificent 7 increased by 15.4%.
The scale of the public-market rebound was driven primarily by faster-than-expected AI adoption and deployment, alongside broader optimism around the technology. While the rally extended beyond the “Magnificent Seven” for the first time in some time, many of the strongest-performing sectors (including semiconductors, power and cooling infrastructure and industrial companies tied to data-center investment) benefited directly or indirectly from AI spending, which contributed to a rapid expansion in public market valuations as investors priced in stronger future growth.
Conversely, the LPMI’s growth was primarily driven by current operating performance, as the LPMI is not subject to the same volatility as the public market repricings as seen in Q1 and Q2 and therefore rebounded to a smaller magnitude compared to the S&P 500 enterprise values after the Q1 drawdown. Finance and technology companies led the way with year-over-year EBITDA growth of 8.5% and 6.5%, respectively, and although industrial companies displayed the lowest year-over-year EBITDA growth, the impact to deal activity may be limited as industrial companies exhibited the least exposure to AI and technology-driven disruption.
“Q2 marked a return to the LPMI’s long-term pattern: private company enterprise value growth was driven by operating performance, not multiple expansion,” noted Steve Kaplan, Neubauer Distinguished Service Professor of Entrepreneurship and Finance at the University of Chicago Booth School of Business, who assists and advises Lincoln on the LPMI. “The public market’s much larger gain likely reflected a rapid repricing of future growth expectations across AI infrastructure and adjacent sectors. Private markets did not participate to the same extent, but they also did not experience the same degree of volatility.”
Private Company Fundamentals Strengthened as Multiples Remained Disciplined
Private company performance strengthened in Q2. The percentage of companies reporting year-over-year revenue growth increased to 70.7% from 69.6% in Q1, while the percentage reporting EBITDA growth rose to 64.0% from 62.4%. The magnitude of growth also accelerated, with year-over-year revenue growth increasing to 6.9% in Q2 from 6.5% in Q1, and EBITDA growth increasing to 5.6% from 4.7%. For context, the 6.9% revenue growth rate was well above the 3.5% year-over-year increase in the Consumer Price Index (CPI), suggesting that aggregate top-line growth was not solely attributable to price inflation. Furthermore, EBITDA adjustments declined to 23.2% of adjusted EBITDA from 24.3% in Q1, indicating an improvement in the quality of reported earnings.
However, stronger performance did not translate into more aggressive valuations for new deals. The average enterprise value multiple for new buyouts was 12.0x EBITDA for the first half of 2026, below the 12.8x average enterprise value multiple for new buyouts for the first half of 2025 but still above the long-term average of 11.5x. This decline in entry multiples also reflects a shift in deal mix, as investors have increasingly pursued lower-multiple sectors such as industrials over higher-multiple sectors such as software.
Software Fundamentals Held Steady, but Leverage Drove Valuation Dispersion
Software fundamentals held steady following Q1’s enterprise value multiple-driven valuation reset. Year-over-year revenue growth edged up to 6.8% in Q2 from 6.6% in Q1, while EBITDA growth moderated slightly to 6.5% from 6.6%, indicating that software kept pace with broader private company performance. As expected, the Q1 repricing reflected anticipatory longer-term disruption risk more than a change in near-term results and outlook.
Loan valuations further showed that the market is differentiating among software credits rather than applying one sector-wide conclusion. Average fair values were 99.0% of par for software loans with LTVs below 35.0% and 97.8% for loans with LTVs between 35.0% and 50.0%, both relatively stable from Q1. By contrast, the average fair value of software loans with LTVs above 50.0% declined by 1.6% to 87.1% of par. The most important dividing lines are therefore business quality and capital structure: the durability of the product’s value proposition, recurring customer demand, retention and pricing power; the extent to which AI enhances or substitutes for the offering; and the amount of equity cushion available to absorb volatility.
“Q2 reinforces that adjustments to software valuations are not one size fits all,” noted Ron Kahn, Managing Director and Co-Head of Lincoln International’s Valuations & Opinions Group. “The relevant distinction is not simply vertical versus horizontal. It is whether a company has a durable value proposition, recurring customer demand and a capital structure that can absorb volatility. Lower-LTV software credits remained well protected, while weaker and more highly levered businesses continued to be marked more selectively.”
Credit Metrics Remained Stable as Lenders Work Through Legacy Stress
At the portfolio level, private credit conditions remained broadly healthy. The size-weighted covenant default rate declined to 2.7% in Q2 from 3.1% in Q1, well below the 3.9% six-year average, primarily driven by improved private company performance and more active portfolio management among direct lenders. That said, Lincoln also evaluated PIK usage to assess credit health, which remained largely steady: PIK interest was present in 11.1% of loans and represented 11.3% of total interest income when considering second-lien and junior debt, compared with 10.8% and 11.9%, respectively, in Q1. Bad PIK (defined as investments with no PIK interest at close but with PIK interest today) was present in 55.4% of loans with PIK in Q2 compared to 55.7% in Q1, or 6.2% of all loans, which may also be viewed as shadow default rate, compared 5.9% in Q1.
Collectively, the data suggest stable credit performance rather than either a broad improvement or deterioration, though pockets of stress remain. Lincoln observed additional lender-control activity during Q2, with lenders foreclosing on $22.3 billion of pre-takeover principal in the first half of 2026, nearly matching the $24.2 billion recorded for all of 2025. The activity remains concentrated in older credits: 70.0% of pre-takeover principal involved 2021 and 2022 vintage buyouts, many underwritten at higher entry multiples and leverage levels. The quantum of debt being taken over by lenders is materially outpacing not just 2025 but all of recent memory, reflecting a paradigm shift in the relationship between sponsors and lenders as these foreclosures were nearly nonexistent all but a few years ago.
Amid the potential stress, along with taking over companies, lenders are looking to generate liquidity in other ways, like turning to the secondary market. Following Q1 pressure on BDCs and other liquidity-sensitive direct lenders, Lincoln observed a meaningful increase in private loans being traded before maturity. As discussed in Lincoln’s July 2026 article, “Direct Lending’s New Price Discovery: What Rising Secondary Trading Activity Means for Valuations, Liquidity and Market Transparency,” investor liquidity demands, among other factors, are creating a broader set of observable transaction data via secondary market trades. Importantly, most trades observed by Lincoln to date have involved instruments valued above 95% of par, often close to par, suggesting that the increase in trading reflects liquidity and portfolio management needs rather than credit concerns.
“Most borrowers continue to service their debt and broad stress metrics remain contained, while a discrete group of older or more levered credits is moving toward lender takeover or sale,” noted Kahn. “The increase in secondary trading is making that differentiation more observable. It is creating liquidity and price discovery, but market participants still need to understand the context behind each trade before treating it as definitive evidence of fair value.”
The Income Cushion Remains Substantial
While the analyses in the prior section illustrate potential signs of stress and the search for liquidity, they do not necessarily describe systemic risk or the overall health of private credit markets. More specifically, private credit does not require perfect credit performance to generate a positive return, as losses are inevitable. To illustrate this, Lincoln performed a levered return analysis, which analyzes what combination of recovery and default rates achieve a zero IRR (i.e., investors recoup their principal but do not get any return).
Under the market-based assumptions reflected in Lincoln’s levered return analysis, which are a 5-year loan with a 1.50% original issue discount (OID), S+5.00% pricing and S+2.00% cost of debt to the fund with 50% leverage, a portfolio would need to experience 9% of cumulative principal loss before its IRR fell to zero. As an example, and as pictured below, that loss level could result from a 12% cumulative default rate at a 25% recovery rate. For the avoidance of doubt, these scenarios are not forecasts; rather, they illustrate the severity of defaults and losses required to fully offset the contractual income generated by a private credit portfolio, assuming no meaningful contribution from equity co-investments.
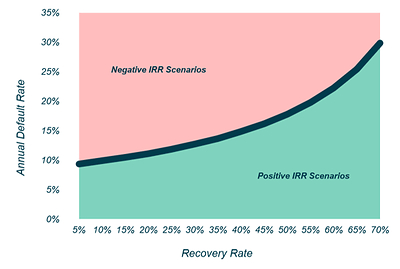
“Private credit is not immune to losses, and the increase in takeovers should not be dismissed,” noted Kahn. “But the asset class can absorb meaningful defaults and losses, to the point where recoveries are more important than defaults because often times, recoveries can offset defaults. Although current observations suggest the market is far off from the illustrated scenarios in the levered return analysis, if it ever were to come up, the key questions would be where the stress is concentrated and how actively lenders manage it.”
About the Lincoln Private Market Index
The LPMI tracks changes in the enterprise value of U.S. privately held companies – primarily those owned by private equity (PE) firms. With the LPMI, PE firms and other investors can benchmark private companies’ performance against their peers and the public markets.
The LPMI seeks to measure the variation in private companies’ enterprise values by analyzing the aggregate change in company earnings as well as the prevailing market multiples for approximately 1,800 private companies, each generating less than $250 million in annual earnings. The index is calculated using anonymized data on an aggregated basis by Lincoln’s Valuations & Opinions Group.
The methodology was determined by Lincoln in collaboration with Professors Steven Kaplan and Michael Minnis of the University of Chicago Booth School of Business. While other indices track changes to a company’s revenue or earnings, the LPMI tracks the total value of these companies. Significantly, the large number of private companies used to create the LPMI helps ensure that the confidentiality of all company-specific information used in the index is maintained.
Important Disclosure
The Lincoln Private Market Index is an informational indicator only and does not constitute investment advice or an offer to sell or a solicitation to buy any security. It is not possible to directly invest in the Lincoln Private Market Index. Some of the statements above contain opinions based upon certain assumptions regarding the data used to create the Lincoln Private Market Index, and these opinions and assumptions may prove incorrect. Actual results could vary materially from those implied or expressed in such statements for any reason. The Lincoln Private Market Index has been created on the basis of information provided by third-party sources that are believed to be reliable, but Lincoln International has not conducted an independent verification of such information. Lincoln International makes no warranty or representation as to the accuracy or completeness of such third-party information.
About Lincoln International
Lincoln International, Inc. (NYSE: LCLN) is a trusted investment banking advisor to business owners, private equity firms and their portfolio companies, and public and private companies worldwide. Our services include mergers and acquisitions advisory, private funds and capital markets advisory, and valuations and opinions. With more than 1,400 professionals in more than 30 offices across 14 countries, we combine perspective on the global private capital markets with deep industry expertise, market intelligence and strategic insights to deliver exceptional execution and build lasting client relationships.
We periodically provide other information for investors on the Investor Relations section of our website at www.lcln.com. We intend to use our website as a means of disclosing material non-public information and for complying with our disclosure obligations under Regulation FD. Accordingly, investors should monitor our website, in addition to following the Company’s press releases, SEC filings and public conference calls and webcasts.

 View original content to download multimedia:https://www.prnewswire.com/news-releases/the-lincoln-private-market-index-earnings-growth-drove-a-q2-rebound-while-private-markets-became-more-selective-302850852.html
SOURCE Lincoln International


